You would think it would be a cause for celebration.
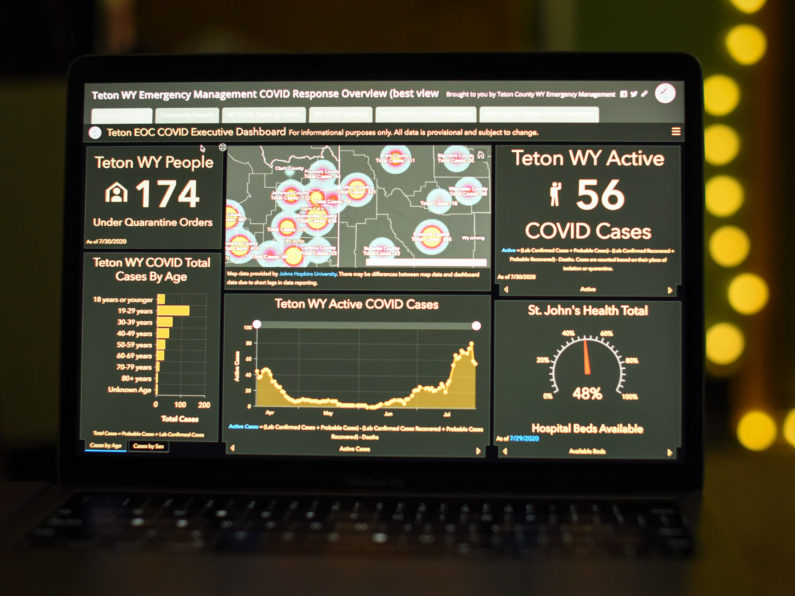
Teton County’s active COVID-19 cases plummeted Wednesday. Anyone tracking cases on the Teton County Emergency Management COVID-19 dashboard watched the number drop from 81 to 59 overnight. But local health officials say it’s too soon to draw any conclusions from this change. “It’s hard to tell what that means for us,” said county epidemiologist Shane Yu. “We really care about long-term trends, not just daily fluctuations.”
Yu’s words point to a problem with the COVID dashboard—residents are using it for daily specifics while the data is about the big picture. This confusion over what the dashboard can and can’t provide is frustrating people who want clarity.
Cathy Lantrip Blount is one resident looking for answers. “I want a complete picture of what we are facing in terms of who is testing positive,” she said.
Unfortunately, that complete picture simply does not exist. The dashboard can only reflect the cases St. John’s Health and Teton County Health Department know about. Design flaws and small print also hamper sussing out what the numbers mean.
Take, for example, this disclaimer printed at the top of the dashboard, “All data is provisional and subject to change.”
Emergency Management does not generate any of the data contained on the dashboard. Instead, it gathers data from various sources like St. John’s Health, Teton County Public Health, and the Wyoming Health Department.
On its COVID page, the hospital notes that its daily reports “include numbers for cases submitted by St. John’s Health only and are accurate to the best of our abilities.”
Kim Deti, Wyoming Department of Health’s public information officer, says the state’s numbers are accurate and up to date. “You may see corrections or clarifications,” Deti said. But overall, she said she is confident in the accuracy of numbers on the state tracks.
Emergency manager Rich Ochs said that human error occurs and that the information itself comes in at different rates. He updates the website Monday through Friday, and he can only input what has been updated on the sites he draws from, like St. John’s Health and the Wyoming Health Department. “There’s no magic here,” Ochs said. “There can definitely be transcription errors. I’ve found them on the state website as well.”
He also acknowledges the dashboard can be cumbersome. “It was the best solution we could come up with,” Ochs said. “Even someone who is looking closely at the dashboard can miss some of the info we have buried in there. On a mobile device, it makes it even harder. It is the nature of the layout of the tool we are using,”
Ochs says nothing on the COVID dashboard should affect anyone’s daily life. The public health message remains the same: wash hands, wear masks, social distance.
But Blount says what she gleans from the dashboard does affect her behavior beyond hygiene and face coverings. She might limit her trips to town or Grand Teton National Park, depending on who is testing positive and where they are hanging out.
“Do we have a lot of tourists getting infected?” she asked. “That would keep me home.”
As COVID-19 cases have spiked in the valley, so too have visits to the dashboard. Since cases started to climb in mid-July, visits to the dashboard went from an average of about 1.5K visits in June to an average of 2.5K visits in July. To find that information, you would need to click on the Community Impacts tab and then scroll through the lower middle section that tracks trends.
Blount’s worries about disease spread by tourists are partially reflected on the dashboard. But only partially. Active cases are based on their place of isolation or quarantine. That includes anyone who is here for a longer stay, tests positive and isolates here. Also included are seasonal workers and part-time residents, along with full-time county residents. A precise breakdown is not available.
Not tracked in the active case number are people who live in other counties, like Lincoln County or Teton County, Idaho, and who may work and recreate in Jackson. Those counties track their COVID metrics differently than Teton County’s model.
Graphs of cases by age and sex are available on the dashboard. But not race/ethnicity. Yu says this omission is deliberate. If demographics of a particular race are low, publicly reporting numbers may lead to unintendedly identifying patients. This would be a breach of their protected health information, Yu said.
For people wanting to understand how specific parts of the community are affected by the virus, this absence of data on the dashboard presents a stumbling block.
“We do have cases in some minority populations,” Yu said. “For the time being, we don’t want to release that information.”
Yu was able to offer some data about the county’s Latinx community. He said that as of July 31, self-identified “Hispanic” individuals accounted for 21 percent of cases. The most recent U.S. Census estimated the county’s Latinx population to be 15 percent, but local advocates say that number is likely around 30 percent.
Yu said there is a chance that Latinx residents are more at risk of contracting COVID-19. But he cautioned about drawing too many conclusions. “By themselves, those numbers don’t tell us anything about why they may be at higher risk,” he said. “The same numbers could result from other factors, not just increased risk of getting COVID.”
Wyoming’s statewide numbers on COVID-19 demographics show that Latinx and Native Americans are disproportionately affected across the state. Native Americans make up 2.7 percent of the state population but account for 17.6 percent of the lab-confirmed COVID-19 cases in the state. Latinx people, meanwhile, comprise 10.1 percent of the population and 15.8 percent of COVID cases.
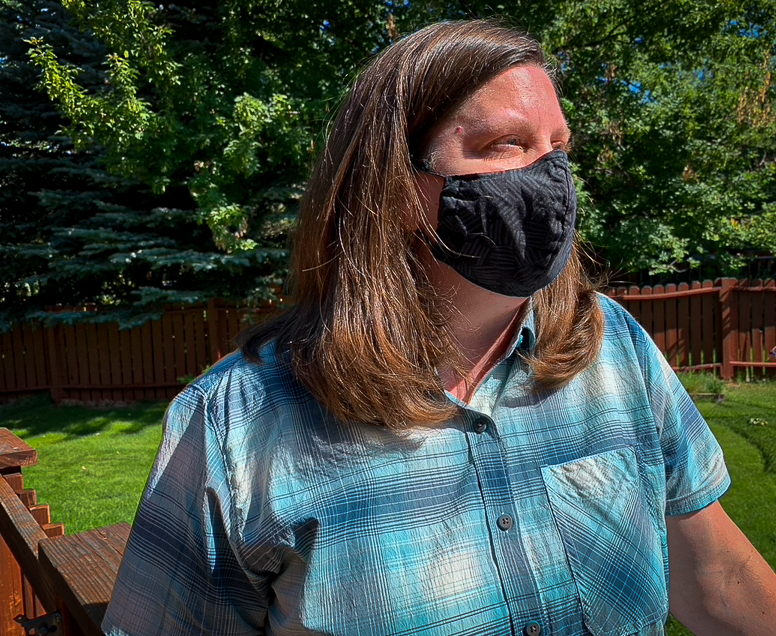
Cathy Lantrip Blount visits the Teton County Emergency Management COVID-19 dashboard daily, but she wants more answers to help inform her daily decisions about where to go and what areas to avoid. (Meg Daly/KHOL)
Craving Context
So, what accounts for a sharp drop in active cases as seen on Wednesday?
It wasn’t because a gaggle of long-term visitors left town all of a sudden, Ochs said. Instead, it’s most likely a number of active cases happened to all recover in the same brief time period. For a patient to be considered recovered, at least 10 days have passed since the onset of symptoms, plus they have no fever and improvement in respiratory symptoms for 72 hours. Because the virus affects individuals differently, recovery dates will vary. It just so happened that a bunch of people recovered on July 28.
Fifty-nine active cases may not sound like a lot. But another number on the dashboard shows how alarming that relatively small number is compared to the county’s population. The cumulative number of lab-confirmed cases per 100,000 people is a way of comparing Teton County to other locations. As of this writing, the number is 1,189. However, this number may not be exact—the state says it is 1,244, and The Washington Post puts it at 1,435. According to the Post’s metrics, Teton County is on par with Denver County, Colorado, for total lab-confirmed cases per 100,000 people. By comparison, Summit County, home to Park City, eclipses the valley with 1,686 cases per capita. However, Pitkin County, home to Aspen, has managed to keep its cases per capita lower than Teton County at 904.6 cases per 100,000 people.
Meanwhile, Teton County Public Health Department metrics page shows that as of July 24, several areas are coded as red, or “concerning.” Those include the number of new cases, community spread, percent of positive cases, testing capacity, and contract tracing capacity.
People are also looking to metrics on reputable national sites for perspective. According to the Harvard Global Health Institute, Teton County is currently in a “red” risk zone. The institute’s risk indicator says this is a “tipping point” zone for which stay-at-home measures are necessary. Their risk levels are calculated based on a rolling seven-day average of daily cases per 100,000 people. Anything over 25 daily cases qualifies as a red risk zone. Teton County is at 51.8.
Cumulative daily cases in leading “red zone” states such as Florida, Louisiana, and Mississippi are all lower than in Teton County. Each state’s overall risk level is based on county rates, which can fluctuate widely. For instance, while Teton County’s rates are only a third of those in Val Verde County, Texas, Teton County is seeing double the amount of daily cases as Los Angeles County.
The Institute’s “Key Metrics for COVID Suppression” was released July 1. According to the website, the metrics framework was designed expressly for “filtering out what matters from a sea of misinformation.”
“We are not even close to the point where we could breathe a sigh of relief.”
– Rich Ochs, Teton County Emergency Management
County resident Kristan Clarke Burba was alarmed to see Teton County in the red zone on Harvard’s site. She wrote to town and county officials July 24 to express her concern. She feels like officials favor a short-term economic boost over reducing community spread so schools can open.
“If we aren’t going to shut down to get back out of the red zone, can we please start discussing a real plan to start reducing spread in our community?” Burba wrote. “Right now, it feels like the well-being of the local citizens, especially children, beyond downtown business owners are an after-thought, if a thought at all.”
As it happens, Burba’s letter preceded a health recommendation Teton District health officer Dr. Travis Riddell issued this week urging bars and restaurants to close by 10 p.m. to slow transmission rates. Contact tracing has shown transmission is happening in these establishments and the likelihood of infection rises as the night progresses, people drink alcohol and notions of physical distancing fade into the periphery, Riddell said Tuesday during a Teton District Board of Health meeting.
Riddell refutes the notion that insufficient attention is being paid to local citizens. “I would suggest heading down to the health department to observe the incredible effort put in on a daily basis by the overworked, underpaid, and increasingly exhausted staff,” Riddell wrote in an email. “That effort includes countless hours spent ensuring schools, daycare facilities, and day camps are operating in the safest manner possible to ensure the health of children.”
The uncomfortable truth is that community spread is real and not necessarily connected to tourists. As the COVID dashboard reports, community spread is at about 31 percent.
“If all our visitors left, we would still have community transmission,” Yu said.
On the plus side, Ochs noted that hospitalizations have not risen with positive cases. “The hospital has capacity,” he said. “We are not in a critical emergency situation right now in terms of hospital beds.”
Hospital capacity, ICU bed availability, and the availability of personal protective equipment are metrics the health department also pays attention to in evaluating the community’s overall risk. All those categories are currently listed as stable. In this way, metrics are looking better than they did in April, Yu said.
One COVID impact that may be impossible to quantify is the level of community anxiety. Ochs said he is aware that constantly refreshing the dashboard can cause undue anxiety. He doesn’t update information on weekend days, and he hopes this adds balance to people’s lives. “How much good is the data doing if it is causing people a lot of stress and strain,” Ochs wondered.
The fact remains, Ochs says, that the virus isn’t going anywhere anytime soon. The dashboard can do a lot of things including showing how well the community has provided support for those in need and connecting users to important resources like the Johns Hopkins University COVID dashboard. What it can’t do is provide a balm to the overall picture, Ochs said.
“We are not even close to the point where we could breathe a sigh of relief.”
To track daily new cases of COVID-19 in Teton County, use the graph in the lower center section of the dashboard. Data for that graph comes from the Wyoming Department of Health’s website, where users can hover over Teton County on the map. The number of lab-confirmed cases in the past 24 hours is listed there. However, it is important to note that an individual could have had the virus for several days prior to a positive test result. “That’s why it’s really important that anyone who is sick gets tested as soon as possible and tries to self-isolate at least until results come back,” Teton County epidemiologist Shane Yu said,
To calculate the valley’s per capita infection rate, the county dashboard uses the total number of lab-confirmed cases to date. This number is tallied by the Wyoming Department of Health. The calculation looks like this: 324 total lab-confirmed cases divided by the county population of 23,464, multiplied by 100,000, which equals 1,380.

